


Help
Until 2016 all profiles have strictly been generated with 1km sections. Later, I started generating more and more profiles in 500m section scale or sometimes even 200m scale.
These higher resolution scales unveil a lot of interesting details, especially irregular slopes, and give a better picture of the character of a climb.

All profiles have been categorized on difficulty from category 5 (easy) to category 1 (very difficult).
These categories are calculated from the profile's profile index and total distance.
Each category covers approximately 20% of all climbs present on CyclingCols.com. So a category 1 climb is amongst the 20% most difficult climbs.
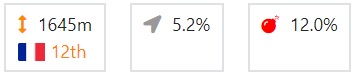
Underneath each profile five global statistics are shown: distance, elevation gain, average slope, maximum slope and profile index (more statistics may be added later on).
A country flag and a rank is shown below if the statistic is amongst the highest values of its country or even of Europe.
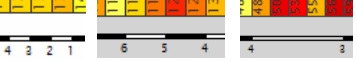
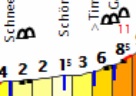
Three banners underneath the profile baseline locate the steepest 5km, 1km and 200m sections within the entire climb.
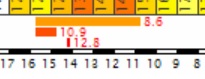
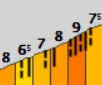
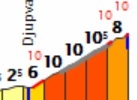
Sections of minimum 200m length that are significantly steeper than the average slope of their covering section are indicated in red.
Tunnels along the route are indicated. Consecutive short tunnels can be denoted by a single tunnel icon.
Not all profiles have yet been generated with tunnel icons.
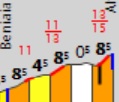
A black solid vertical line just underneath the profile stands for a hairpin curve to the right, a dashed one depicts a leftward hairpin curve.
Not all profiles have yet been generated with hairpin curve indicators.
Unpaved sections of the road are indicated by a gray line along the profile.
The profile index indicates the difficulty of a climb. It is calculated as the summed squares of the (positive) slopes of each interval between two successive data points. It therefore slightly depends on the data density available although most CyclingCols profiles share a data density of approximately 20 points per kilometer.
Example: a climb of 5 km with a constant slope of 5% has a profile index of 5*5^2 = 125. If one kilometer ascends at 6% the profile index raises to 4*5^2+6^2 = 136. A steeper climb that covers the same elevation gain of 250m will have a higher profile index. It will be 2.5*10^2 = 250 if the climb has a constant slope of 10%.